PePTA: Petroxin Pressure Transient Analysis
Pressure and flow rate data can be easily entered using industry standard formats as well as any text files. Data can be loaded in a wide range of formats including ASCII, PAS, LAS, TRP and Excel. Data can be also copied from any software package such as Microsoft Office and exported to PePTA.
There are options for selecting and editing data in tables or directly on plots. Zoom and select options are designed based on specific needs of a well test analyser. For any plot or table, full data copy and paste facilities are available to export data or images to other programs.
There is no practical limit for the number of pressure data points, provided that PePTA is installed on a moderate computer. We have tested the software with 300,000 data points.
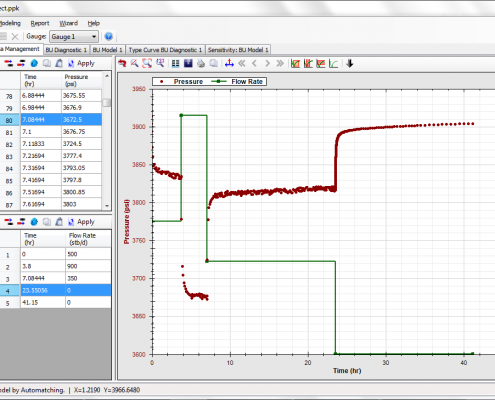
Data management panel
Diagnostic plot of pressure and pressure derivative is drawn to define flow regimes and also estimate parameters. Primary pressure derivative can be plotted for sake of data quality control and assurance. Specialized analysis lines can be simultaneously drawn on logarithmic, semi-logarithmic, Cartesian, linear, bilinear and spherical plots. Specialized line analysis in PePTA include:
- Wellbore storage
- Radial flow
- Linear flow
- Bilinear flow
- Spherical flow
- Dual porosity
- Pseudo steady state flow
- Radius of investigation
There is an option for selecting well test model by comparing pressure derivative plot to type curves. A complete set of wellbore, reservoir and boundary type curves is included and can be simply browsed.
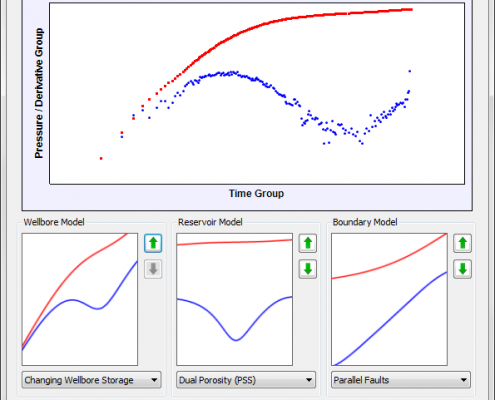
Model Selection Wizard
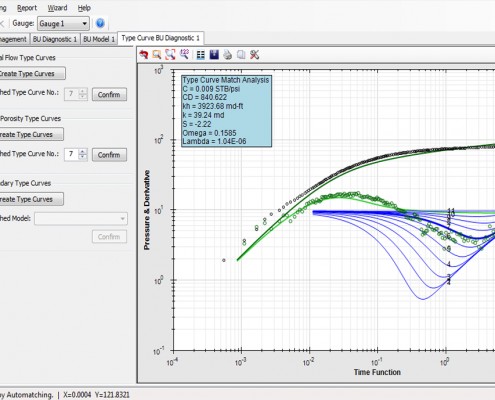
Type Curve Matching
Defining a model for matching
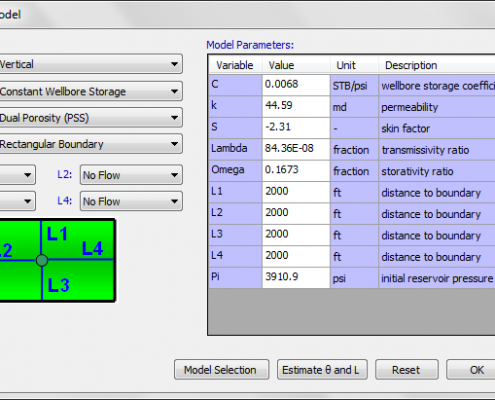
PePTA uses analytical models for well test analysis. Well test models are composed of well, wellbore, reservoir and boundary models. Frequently used models are includes and new models are being added to PePTA. Any combination of estimated values from diagnostic analysis plots can be selected as initial set for auto-matching. Currently the following models are available inPePTA:
Wellbore Models:
- No wellbore storage
- Constant wellbore storage
- Changing wellbore storage
Reservoir Models:
- Homogeneous
- Dual porosity (pseudo-steady state)
- Dual porosity (unsteady state slab)
- Dual porosity (unsteady state slab)
- Radial composite
- Double layer
Boundary Models:
- Infinite
- Single fault
- Closed circle
- Intersecting faults (30 degrees)
- Intersecting faults (45 degrees)
- Intersecting faults (60 degrees)
- Intersecting faults (120 degrees)
- Parallel faults
- Two perpendicular faults
- Three perpendicular faults
- Rectangular
Boundary models can be no-flow or constant pressure or any combination.
PePTA uses hybrid genetic algorithm and Levenberg-Marquardt for auto-matching and error minimizations as a non-linear regression method. Auto-matching is fast and effective. Scattered points can be easily filtered out to have a proper matched model.
In PePTA, we have added a difference plot to compare measured pressure and calculated model. This option is unique and helps user examine how data in three times or regimes are matched.
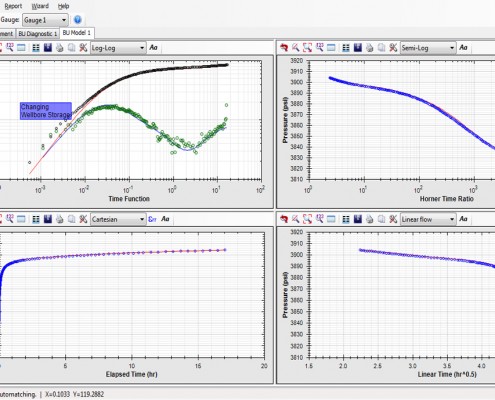
Matched model plots
Four plots are drawn in a same panel for simultaneously checking models in different time regions and specific flow regimes. Plot types can be changed based on the interpretation.
To further investigate the effect of model variables, we have added sensitivity analysis plots with single or multiple variable selections. Any combination of variables is allowed for sensitivity analysis. The sensitivity analysis plot can be drawn in logarithmic, semi-logarithmic and Cartesian plots of which, two later plots are not available in other well test analysis packages.
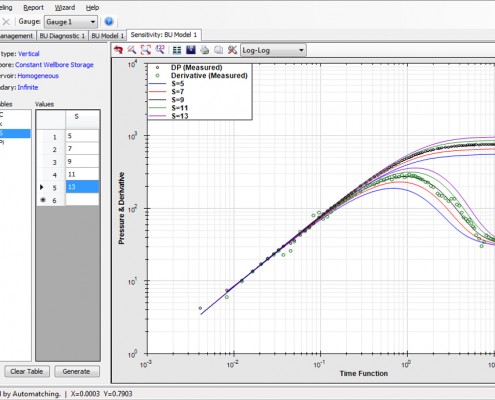
Sensitivity Analysis
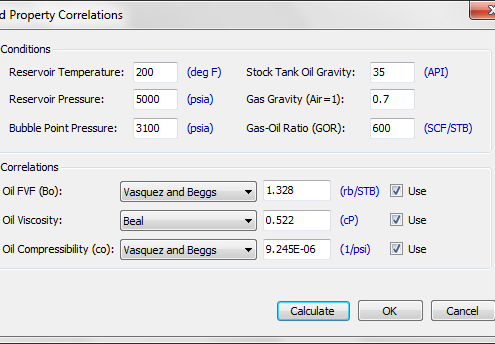
In some occasions, laboratory PVT analysis is not available.PePTA has a library of well-known correlations for oil and gas fluids for calculation of PVT properties. The following lists the available correlations for oil and gas property calculation:
Oil Formation Volume Factor, Bo:
- Vasquez and Beggs
- Standing
- Glaso
- Petrosky and Farshad
Oil Viscosity, µo:
- Beal
- Beggs and Robinson
- Glaso
Oil Compressibility, co:
- Vasquez and Beggs
- Petrosky and Farshad
Rock Compressibility, cr:
- Consolidated Limestone
- Consolidated Sandstone
- Unconsolidated Sandstone
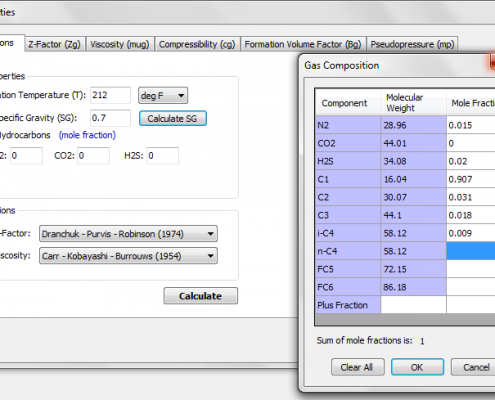
Gas Compressibility Factor, Z:
- Dranchuk – Purvis – Robinson
- Hall – Yarborough
- Dranchuk – Abu Kassem
Gas Viscosity, µg:
- Carr – Kobayashi – Burrouws
- Lee – Gonzalez – Eakin
- Dean – Stiel
Other features of PePTA include:
- Test design
- Deconvolution algorithm of removing wellbore storage effect
- Ability to load, plot and analyse large data sets up to 300,000 points
- Gas back-pressure, isochronal and modified isochronal analysis
- Simplified c,n and LIT analysis for back pressure tests
- Logarithmic and linear data filtering
- Quick estimation of distance to boundaries and faults
- Estimation of angle between two intersecting faults
- Oil and gas wells IPR plots
- Simple report generation
- Inserting annotations and comments in any plot
- Smoothing pressure derivative curve
- Multiple specialized line of the same type
- Rate dependent (non-Darcy) skin calculation
- Easy exporting plots and data to other programs such as Microsoft Office packages
- Compare several analysis and models